If you want to buy a home but are waiting for housing to become more affordable, you want to be paying attention to what’s going on with the economy.
The Federal Reserve paused rate hikes last week thanks to several indicators pointing towards a cooling economy:
- Core CPI is currently at 4.3% year-over-year, which has improved from the high of 6.6% in September of last year but still not near the 2% target.
- The number of job openings went down to 8.8 million in July from 9.17 million in June, which is the lowest since early 2021.
- The unemployment rate in August rose to 3.8% from 3.5% in July, which is still historically low but the highest it’s been since February 2022.
Even though progress is being made on slowing down the economy, many Fed members haven’t ruled out the possibility of additional rate increases this year and into 2024.
As we’ve written about many times before, mortgage rates always go down during and immediately following recessions. In most areas of the country, home prices are not going to fall because of the lack of supply and high demand. However, housing will become more affordable when the economy slows down, and mortgage rates fall as a result.
Can We Still Have a “Soft Landing”?
Many people are looking at that 1994 experience to anticipate what might lie ahead in the present day, but there are some major differences between 1994 and 2023. The autoworker strike, a possible government shutdown, the resumption of student loan repayments, higher energy prices, and higher long-term borrowing costs could affect the trajectory of the economy and inflation. The Federal Reserve has two goals: to keep inflation low and steady and to maximize employment. Right now, all it is focused on is bringing inflation down without forcing millions of people to lose their jobs. Unfortunately, it’s really difficult to do that when inflation has been so high.
The Fed is painting a very rosy picture about the economy, and it is still optimistic that the US will be able to achieve what economists are calling a ‘soft landing’. A soft landing today would mean the economy slows down enough to reduce inflation to near the 2% target without a recession. Basically, the Fed’s goal is to get the country to slow down on spending without putting millions of people out of work.
Has there ever been a truly soft landing after an aggressive monetary tightening policy like we are experiencing today? Yes, but only once. The only time that the Fed actually achieved a soft landing was in the mid-1990s.
In early 1994, the economy was still in recovery after the 1990-91 recession. By early 1994, the unemployment rate was falling rapidly, and inflation was just under 3%. But with the economy growing and unemployment shrinking rapidly, the Fed was concerned about future inflation and decided to raise rates preemptively.
During 1994, the fed funds rate increased seven times, doubling from 3% to 6%. Once the Fed saw the economy softening more than required to keep inflation from rising, it ended up cutting rates three times in 1995.
The result was successful, and the US economy was very strong for the next five years. Inflation was low and steady, unemployment continued to trend downwards, and real GDP growth averaged above 3 percent per year.
3 Recession Indicators We Are Watching
In 2022, predictions of a 2023 recession were widespread, but more recently those voices have been getting quieter. Larry Summers, the former Treasury secretary and a prominent skeptic of a soft landing, said in April 2022:
If you look at history, there has never been a moment when inflation was above 4% and unemployment was below 5% when we did not have a recession within the next two years.
The following three recession indicators have all predicted economic downturns with 100% accuracy, and they’re all in agreement on what happens next.
Inverted Yield Curve
The first surefire recession-predicting tool is the difference in yields (i.e., the “spread”) between the 10-year and three-month Treasury bond. – also known as the yield curve.
A healthy or normal yield curve is one where longer-term bonds have higher yields or interest rates than shorter-term bonds. For example, the 2-year Treasury might have a yield of 3% while the 10-Year has a yield of 4%.
Longer terms mean more risk, so investors demand higher returns. However, when a recession is expected, the yield curve is not normal and becomes inverted. This means shorter-term bonds have HIGHER yields than longer-term bonds.
The graph below shows the historical difference between the yields of the long-term 10-Year Treasury bond and the short-term 3-Month Treasury bond. When the line drops below 0, it means that shorter-term bonds are offering higher returns than longer-term bonds.
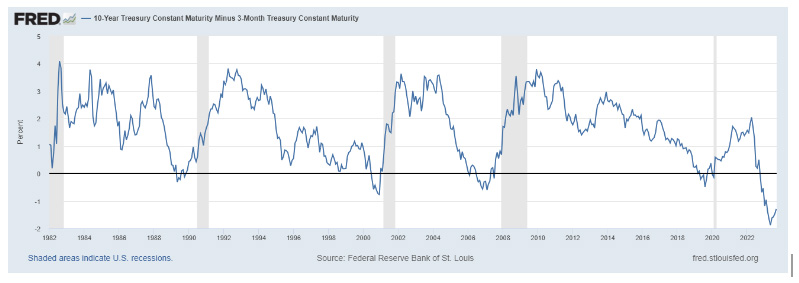
The gray bars in the graph represent U.S. recessions. As you can see, every time the yield curve has inverted, a recession has immediately followed – and right now the yield curve is the most inverted it has ever been. We take this to mean a recession is at our doorstep.
Real GDP vs. GDI
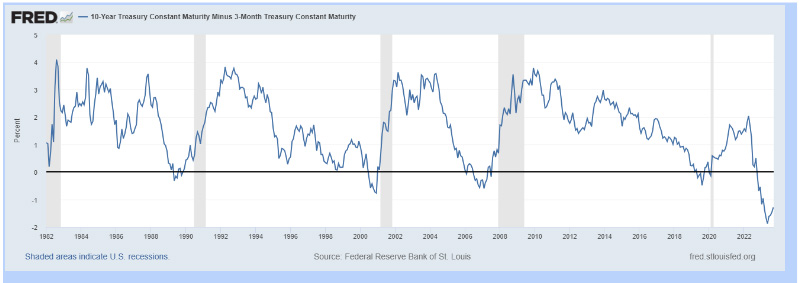
The gray bars in the graph represent U.S. recessions. As you can see, every time the yield curve has inverted, a recession has immediately followed – and right now the yield curve is the most inverted it has ever been. We take this to mean a recession is at our doorstep.
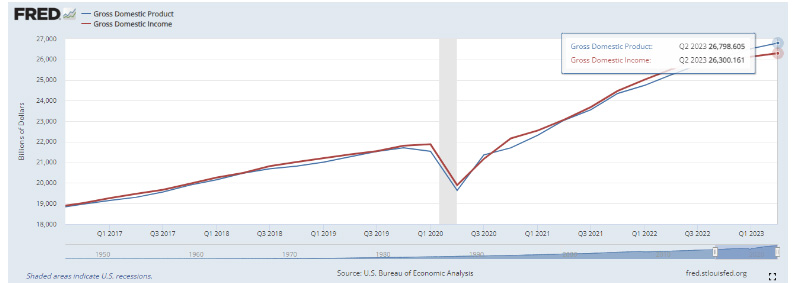
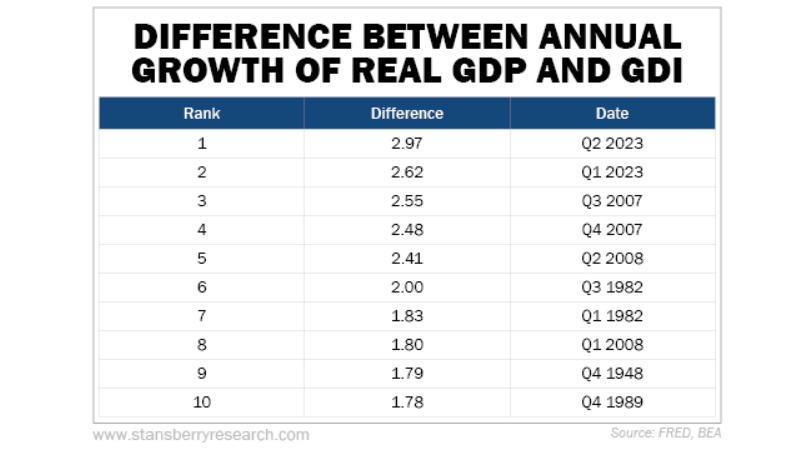
The second indicator is the difference between US gross domestic product (GDP) and gross domestic income (GDI). Stansberry Research did a great job illustrating this in their recent Morning Briefing.
For every dollar someone spends on a good or a service – such as a movie ticket, a new watch, or a haircut – another individual earns a dollar of income to deliver that good or service. GDP captures the spending side of these transactions. GDI captures the income side.
In a perfect world, GDP and GDI would be the same, but there is always some minimal difference because each is measured using different data sets and different sources.
When we see a large gap between GDP and GDI, it can be a warning sign for the economy. And the gap is larger than normal right now.
Leading Economic Indicators
The third recession indicator that’s been spot-on when it comes to forecasting U.S. recessions since 1959 (or 64 years ago) is the Conference Board Leading Economic Index (LEI).
The LEI is a predictive tool comprised of 10 inputs that’s designed to “anticipate turning points in the business cycle by around seven months.” These inputs include financial components, such as the S&P 500 index of stock prices and the interest rate spread, as well as nonfinancial components, like ISM New Orders, average consumer expectations for business conditions, and average weekly hours (manufacturing).
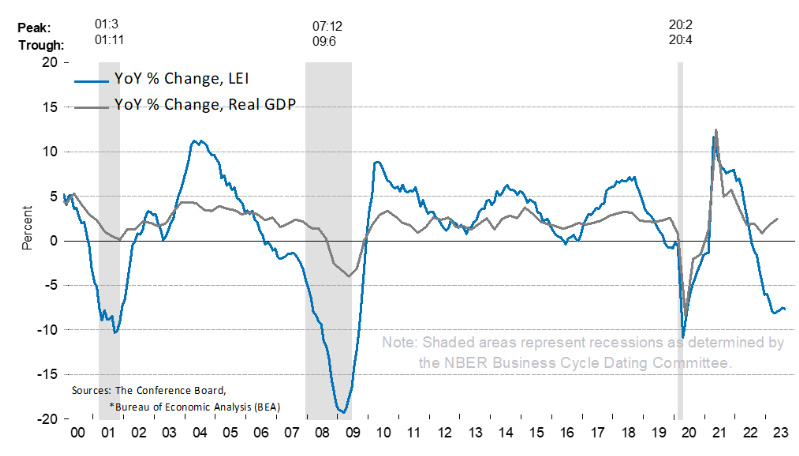
According to Justyna Zabinska-La Monica, Senior Manager, Business Cycle Indicators, at The Conference Board,
With August’s decline, the US Leading Economic Index has now fallen for nearly a year and a half straight, indicating the economy is heading into a challenging growth period and possible recession over the next year.
The Bottom Line
While an economic slowdown needs to happen to help taper inflation, it hasn’t always been a bad thing for the housing market. Typically, it has meant that the cost to finance a home has gone down, and that’s a good thing.
But remember, a slowing market does not mean a crashing one! Even though mortgage rates have increased, demand for homes is still very high. This has led to home prices reaching all-time highs in many areas of the country.
Mortgage rates will drop when the economy slows down, which we expect to happen later this year or in the beginning of 2024. When that happens, even more people will want to buy a home. This will keep home prices rising, which means the sooner you buy a home, the sooner you will benefit and see your home equity grow.
Let’s Chat.
I’m sure you have questions and thoughts about the real estate process. I’d love to talk with you about what you’ve read here and help you on the path to buying your new home.
Michelle Oddo
Mortgage Wealth Advisor, The Oddo Group
michelle.oddo@goluminate.com
(303) 961-6906

